Share on Social Media:
The Top 5 U.S. Pizza Restaurant Brands with the Most Sales
| Pizzeria | U.S. Pizza Sales (2011) |
Percent Change (2011) |
Number of U.S. Franchises | |
|---|---|---|---|---|
| 1 | Pizza Hut | $5,40 billion | 0.0% | 7,595 |
| 2 | Domino's | $3,40 billion | + 2.9% | 4,907 |
| 3 | Papa John's | $2,19 billion | + 4.7% | 3,518 |
| 4 | Little Caesars | $1,48 billion | + 18.1% | 3,001 |
| 5 | Papa Murphy's Take 'N' Bake | $702 million | + 10.6% | 1,283 |
 Special Report
- As of March 2009, there were approximately 64,951 pizza restaurants in the United States, 42% were chains and 58% were independent restaurants. Consumers report that 45 percent of pizza orders are takeout, 36 percent are delivery and 20 percent are dine-in. Pizza sales for the year 2009 were $32.286 billion dollars with independent restaurants accounting for 51.66% of total pizza sales in the United States. Approximately 3 billion pizzas are sold in the U.S. each year. Pizzerias represent 17% of all restaurants and pizza accounts for more that 10% of all foodservice sales. Americans eat approximately 100 acres of pizza each day, or about 350 slices per second. 16% of the pizzas ordered in the United States in 2009 were ordered online.
- Cheese accounts for roughly 40% of the cost of a restaurant pizza, making it the most important menu ingredient by far with respect to costs. 86% of pizza consumers say they prefer to choose their own toppings as opposed to ordering a specialty pizza.
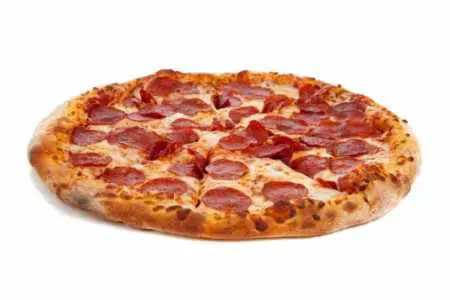
- Pepperoni is by far America's favourite topping, (36% of all pizza orders). Approximately 251,770,000 pounds of pepperoni are consumed on pizzas annually. Other popular pizza toppings are mushrooms, extra cheese, sausage, green pepper and onions. 62% of Americans prefer meat toppings on their pizza, while 38% prefer vegetarian toppings.
- Delivery accounts for 34% of all pizza meal occasions compared to just 2% of all other restaurant meals.
- There is one pizza restaurant for every 4,330 U.S. residents. The Big Four pizza chains (Pizza Hut, Domino's Pizza, Papa John's and Little Caesars Pizza) represent 36.8% of industry sales at $10.81 billion. The top 50 pizza chains in the United States own 42% of pizzerias and control 48.34% of pizza sales.
- Barrett, Liz. "Pizza Power Report 2010". PMQ Pizza Magazine. September, 2010. 56+.
- Food Industry News, Blumenfeld and Associates.
Tags:
Business, Finance & Industry, Top 5 Most, Food & Drink, The United States, Brands & Consumer Products
Sources: PMQ Pizza Magazine. (2013). "Top 50 U.S. Pizzerias: Ranked by Sales". (Latest available data as of January 2014). Please visit the source here
List Notes: List is top 5 pizza chains in the United States ranked according to domestic sales for the year 2011 in U.S. Dollars.
Sources: PMQ Pizza Magazine. (2013). "Top 50 U.S. Pizzerias: Ranked by Sales". (Latest available data as of January 2014). Please visit the source here
List Notes: List is top 5 pizza chains in the United States ranked according to domestic sales for the year 2011 in U.S. Dollars.

