Share on Social Media:
The Top 5 Countries with the Most Inequality
| Country | Wealth Share of Richest 1% | Number of Millionaires | |
|---|---|---|---|
| 1 | Russia | 74.5% | 132,000 |
| 2 | India | 58.4% | 245,000 |
| 3 | Thailand | 58.% | n/a |
| 4 | Indonesia | 49.3% | n/a |
| 5 | Brazil | 47.9% | 164,000 |
 Special Report
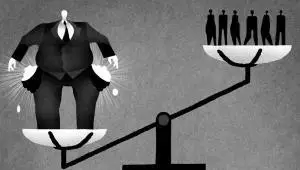
- Between the years 1980 and 2016, inequality between the world’s citizens increased, despite strong growth in emerging markets. The share of global income accrued by the richest 1%, grew from 16% in 1980 to 20% by 2016. Meanwhile the income share of the poorest 50% hovered around 9%. The top 1% – individuals earning more than $13,500 per month – globally captured twice as much income growth as the bottom 50% of the world population over this period. (1).
- The wealthiest 1% of the world's population own 50.1% of all the household wealth in the world. (3).
- There is ample evidence to suggest that as the gap between the richest and the poorest increases, happiness and levels of fulfillment decrease; not only for those at the bottom, but for those at the top as well. This gap, and the stress associated with it, is contributing towards mental health issues and reducing productivity at work – bad for both business and society. (2).
- As of 2018, the inequality crisis is worsening. 82 percent of the wealth created last year went to the richest one percent of the global population, while the 3.7 billion people who make up the poorest half of humanity got nothing. (4).
- Around 56% of the global population lives on between $2 and $10 a day, while it takes just four days for a CEO from one of the top five global fashion brands to earn what a Bangladeshi garment worker will earn in her entire lifetime. (4).
- The Harvard Business Review. (2018). "40 Years of Data Suggests 3 myths about globalization."
- Dawks, B. (2017). A Blueprint for better Business: "The Role of Business in Inequality".
- Credit Suisse Research Institute. (2018). "Global Wealth Report 207"
- Oxfam International. (2018). "5 shocking facts about extreme global inequality and how to even it up"
Tags:
Country Statistics, The Economy, Top 5 Most, India, Russia
Sources: Credit Suisse: “ Global Wealth Databooks 2018 "
List Notes: Data is top 5 countries with the most inequality calculated by share of total wealth of richest 1%. Data is for the year 2017.
Sources: Credit Suisse: “ Global Wealth Databooks 2018 "
List Notes: Data is top 5 countries with the most inequality calculated by share of total wealth of richest 1%. Data is for the year 2017.

